Based on my experience, this is quite mandatory during a POC to analyze in detail what the cost is.
Why? because most of the components deployed are based on a variable, which is frequently the amount of data “ingested”.
One of the easy way to do so is to go in the Log Analytics workspace, and check the costs.
But what I also like to do is to leverage Kusto Queries in a workbook, so we can have a deeper vision, and potentially correlate the cost with some more technical information.

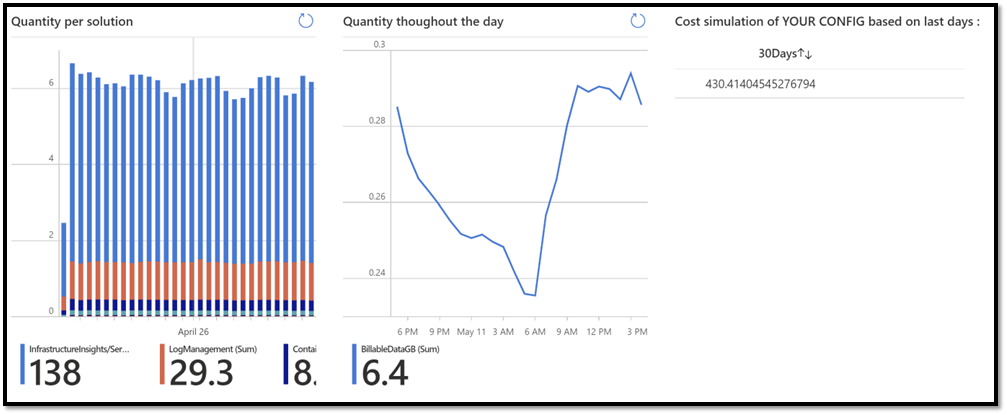
In this example, I have 3 queries:
- One look at the cost per day per component
- The second looks at the quantity of data gathered per hour, in the last 24 hours
- The 3rd one look at the cost of yesterday, and computes what would be the cost – if we stay with this configuration (#of servers, activated components) on a monthly basis.
Keep in mind that this cost is the only one related to services leveraging Log Analytics. You may have extra costs from other components such as Policies, … Than, have a look at either Cost Management, or leverage PowerBI and connect it via the available connector to get Billing (API) data.
If you want to download a lot of queries, especially the one in the screenshot, have a look at this article: Click here
Version 1.0