As you probably know, a lot of products capture data and then store it in Azure Log Analytics.
Then, either via the GUI of the Azure portal or via Kisto Queries, you can extract the relevant information and value it.
Part of Azure Portal, you can create “workbooks”, the friendly name of reports in Azure.
Such technology will give you the opportunity to create nice reports, which can be subdivided in sections, each section containing multiple queries.
The goal is to extract the relevant data and display it in a way that you will be able to value each service that has captured this interesting content.
Do you need to learn Kusto as a first step?
When running a POC or deploying a component in production, you may ask yourself: should I learn and become a Kusto expert?
Well, one of the lessons learned is that if we start by this, we will spend a lot of time learning a new query language and not focus on the very goal which is to get the best value of such data.
Based on that experience, I have created a sample “workbook” that contains a lot of Kusto queries. Then rather than starting from scratch you can get inspired, and just duplicate and adapt some of them for your own purpose.
This workbook is downloadable and is free of charge.
What is the value of this approach?
- You will have a lot of Kusto examples.
- The workbook is divided in sections. Each section represents an “angle of analysis”, such as AD, SQL, network security.
- Adding the report in your own environment takes 30 seconds.
How to download and install this report
First, download the report from the “Download history” section at the end of this post.
It is a basic txt file that contains a Json structure, which corresponds to the way that Azure Portal “stores” your report when you edit it with the GUI.
Once downloaded, go in Azure Portal, create a new workbook and save it.
Then, go in EDIT mode, hit the </> button, and you will see the Json of your current report. Delete all the JSON data, and copy the content of the download file in the GUI.
Go back to edit mode, Save again and you will see this report.
Understand the logic: The structure of this report
Below is an example of the report from an internal demo environment.
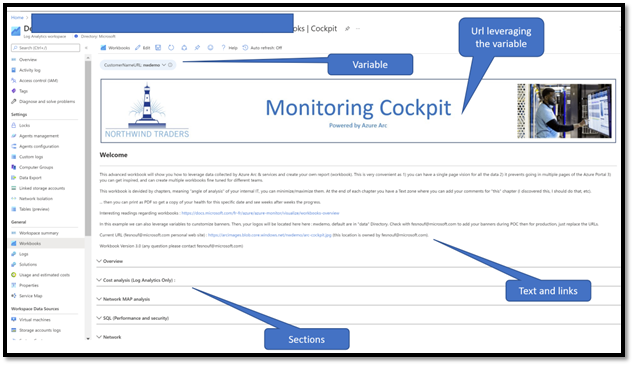
For those of you who are not familiar with workbooks we can use different elements to make the report a little bit more interesting.
We start with a text variable where I put the name of the environment (customer) I want to analyze. Then, the next element contains an URL to a JPG file, and the “path” contains the value of the variable. This makes the demo universal: I believe that it is important to see the customer logo during demos.
Then I continue with a text and link section, very straight forward, just to show how to display text information.
Then you have the different sections I mention earlyer. You can minimize them (as they are below), and of course maximize them:
IMPORTANT: My main goal for this logic is to make sure that you have all the good Kusto query samples regrouped around an axis of analysis. This make the demo more interesting.
Workbooks in more detail
For those of you who are not experienced in workbooks let me share with you the basics to understand and value this report.
Below is a screenshot of the report, I have just expanded one section called Overview.
In my mind “Overview” is a bunch of queries I would like to quickly show to a customer. As you can see on the screenshot, this section displays 3 “visuals”.
Each of these visuals is the result of a Kusto query (to retrieve data) and of course a way to “display it” : Table, graphical, etc.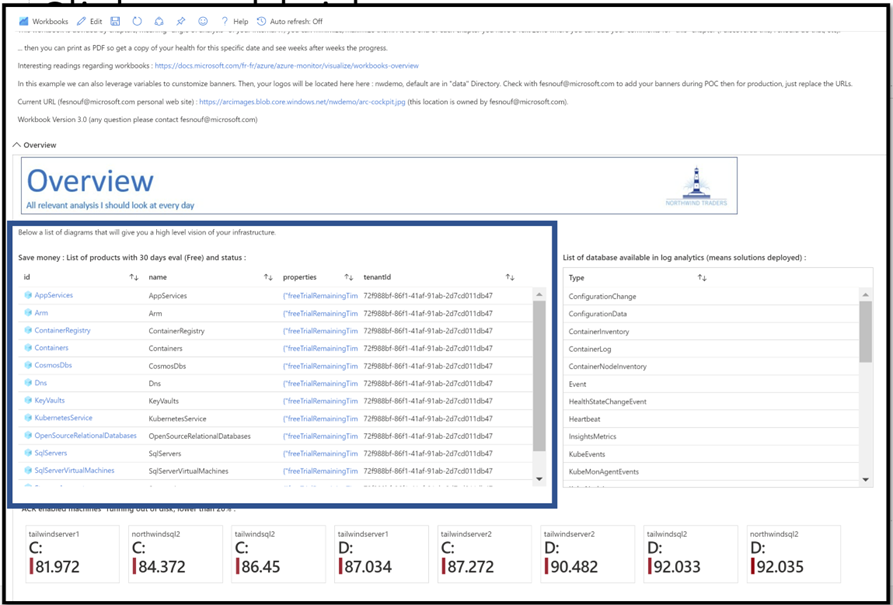
To edit and see how it works, you need first to EDIT at the workbook level, and then, EDIT the section. Finally, EDIT the visual you want to investigate.
Now, via the SETTINGS section but also ADVANCED and STYLE, you can adapt the way it is rendered.
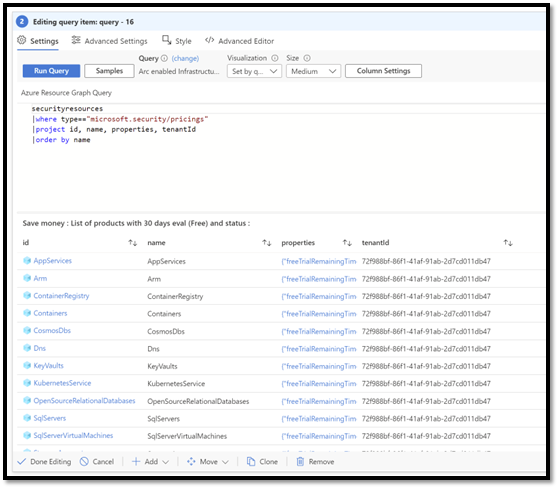
So, one of the things you should do after loading the workbook on your environment, is to edit each section, each visual, and familiar yourself with the Kusto queries.
How to leverage this report
On my day-to-day job, I frequently meet customers that have already deployed Azure Arc. My goal then is to understand what they have deployed and of course maximize their deployment.
As you understand how it works, a service has been deployed and capture some data and put it in Log Analytics. We want then to get the best ROI possible of this valuable data.
So what is the classical way to do it? let’s dig in.
1 – Identify what is deployed in the customer environment
I always start with this visual:
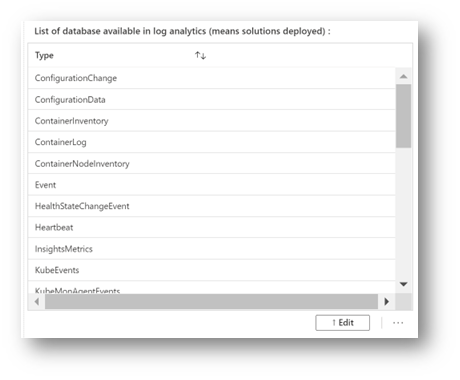
The Query Kusto behind just list the “databases” present in the Log Analytics workspace.
With a little bit of training, you quickly identify the name of the services behind the name of the databases.
For example:
- Here we can see “Heartbeat” which is generated by the agent. It says frequently that it is alive, the version deployed, etc
- We can see multiple “Kube” databases. Dig in and see what data is captured
- Events: represents the event logs captured “inside” a VM
- ConfigurationChange captures all the changes in a server, and is used to identify the change management story
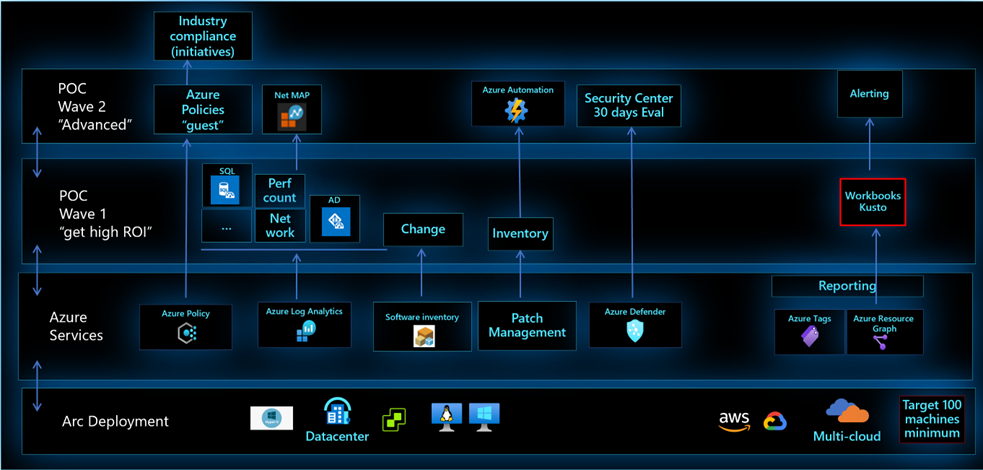
2 – What is missing (before we optimize the existing services)?
Once you know the databases you can then see if other components are missing, giving more value to the global solution.
I like to use that “MAP” of services in order to identify what is missing, and so advise the customer to activate what could make sense for their scenario:
3– Let’s get the best value for each deployed component
Once we have identified the valuable missing components and activated them, we can deep dive – 1 by 1 – and get the best value which will lead to other Posts.
Back to the purpose of this document, download and install the workbook, install it, discover the scenarios and relevant Kusto queries.
Download
On June 17, I had the pleasure to run a session on this topic, invited by Stanislas Quastana, Microsoft France.
The version of the workbook used for this video is V3, you can download it here: Latest version: Click here
For those of you who would like to see Stan’s video, you can activate English subtitles, click here: Analyse détaillée des environnements Azure Arc avec les Workbooks & Kusto (juin 22) – YouTube
Version 2.0